One of my personal goals for 2021 is to increase my writing frequency here at this website. A little over 14 years ago (!) I did some analysis on my posting habits, and I thought I'd do something similar to see how my posting has changed over time. Using a quick Python script and matplotlib, the latter of which I don't use frequently enough to ever remember how to use, I came up with the following two diagrams:
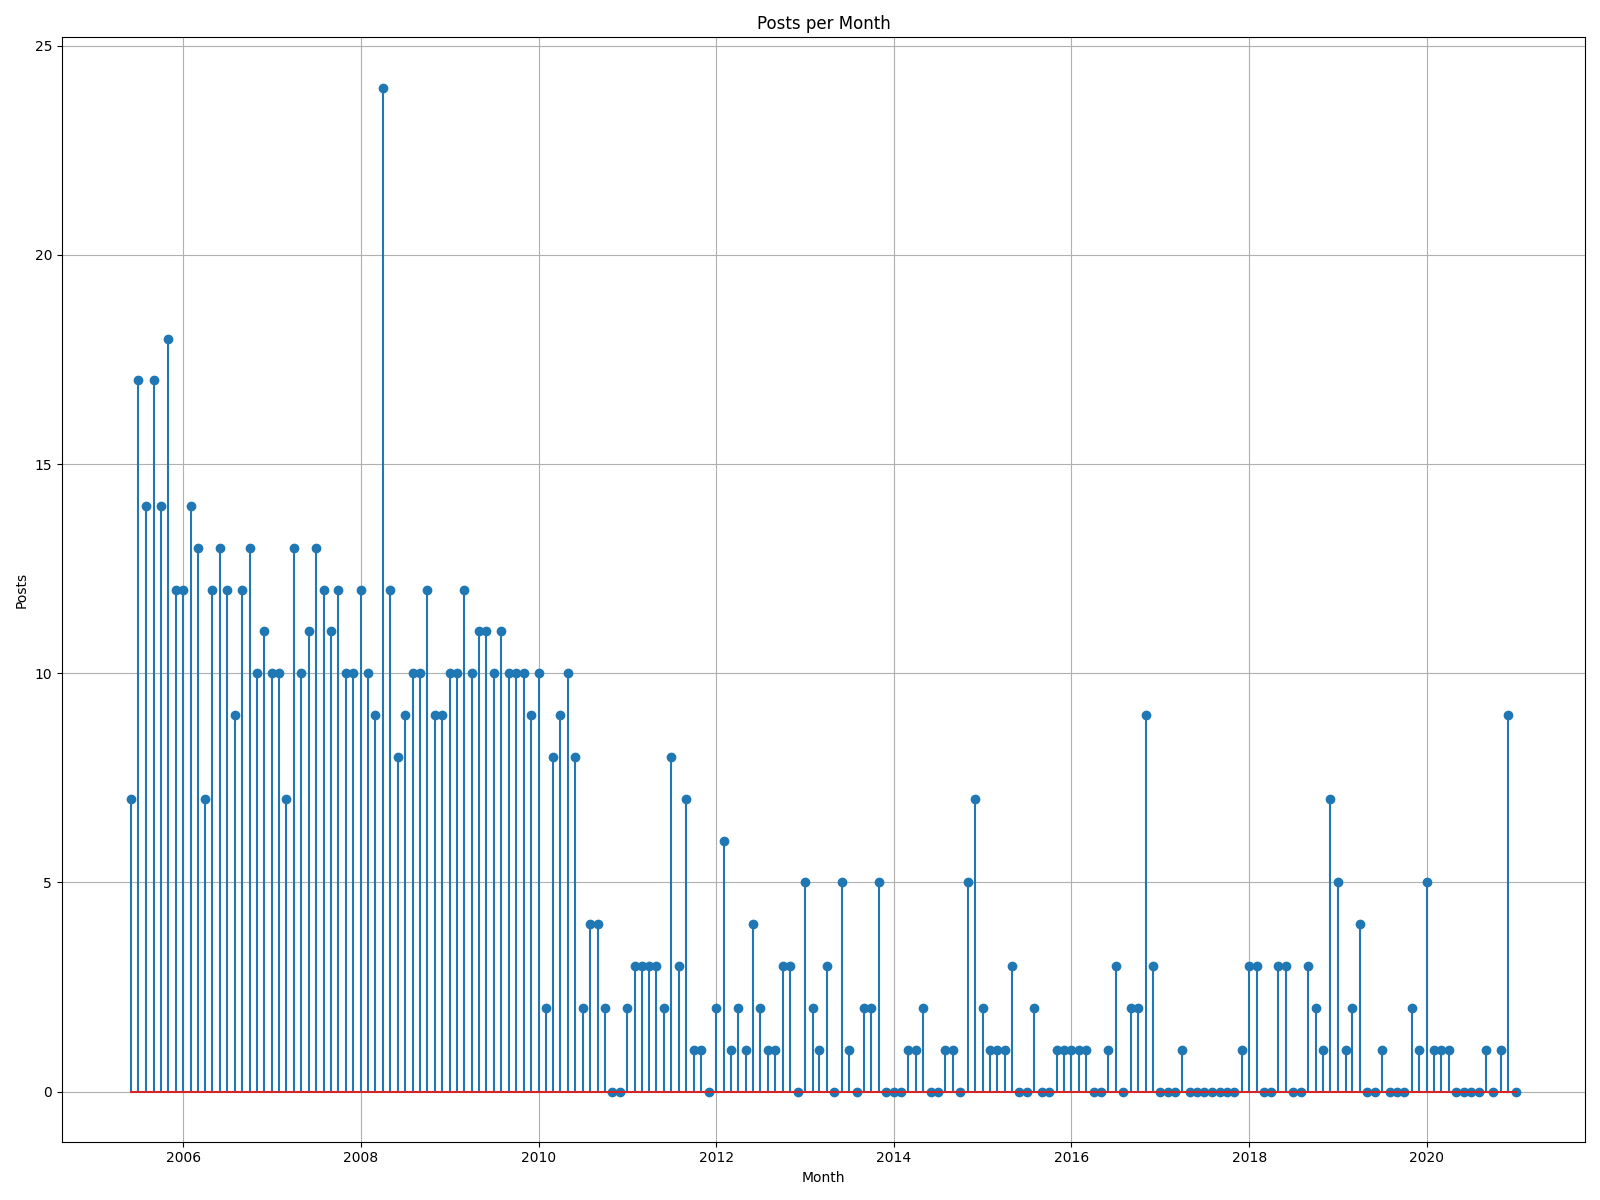
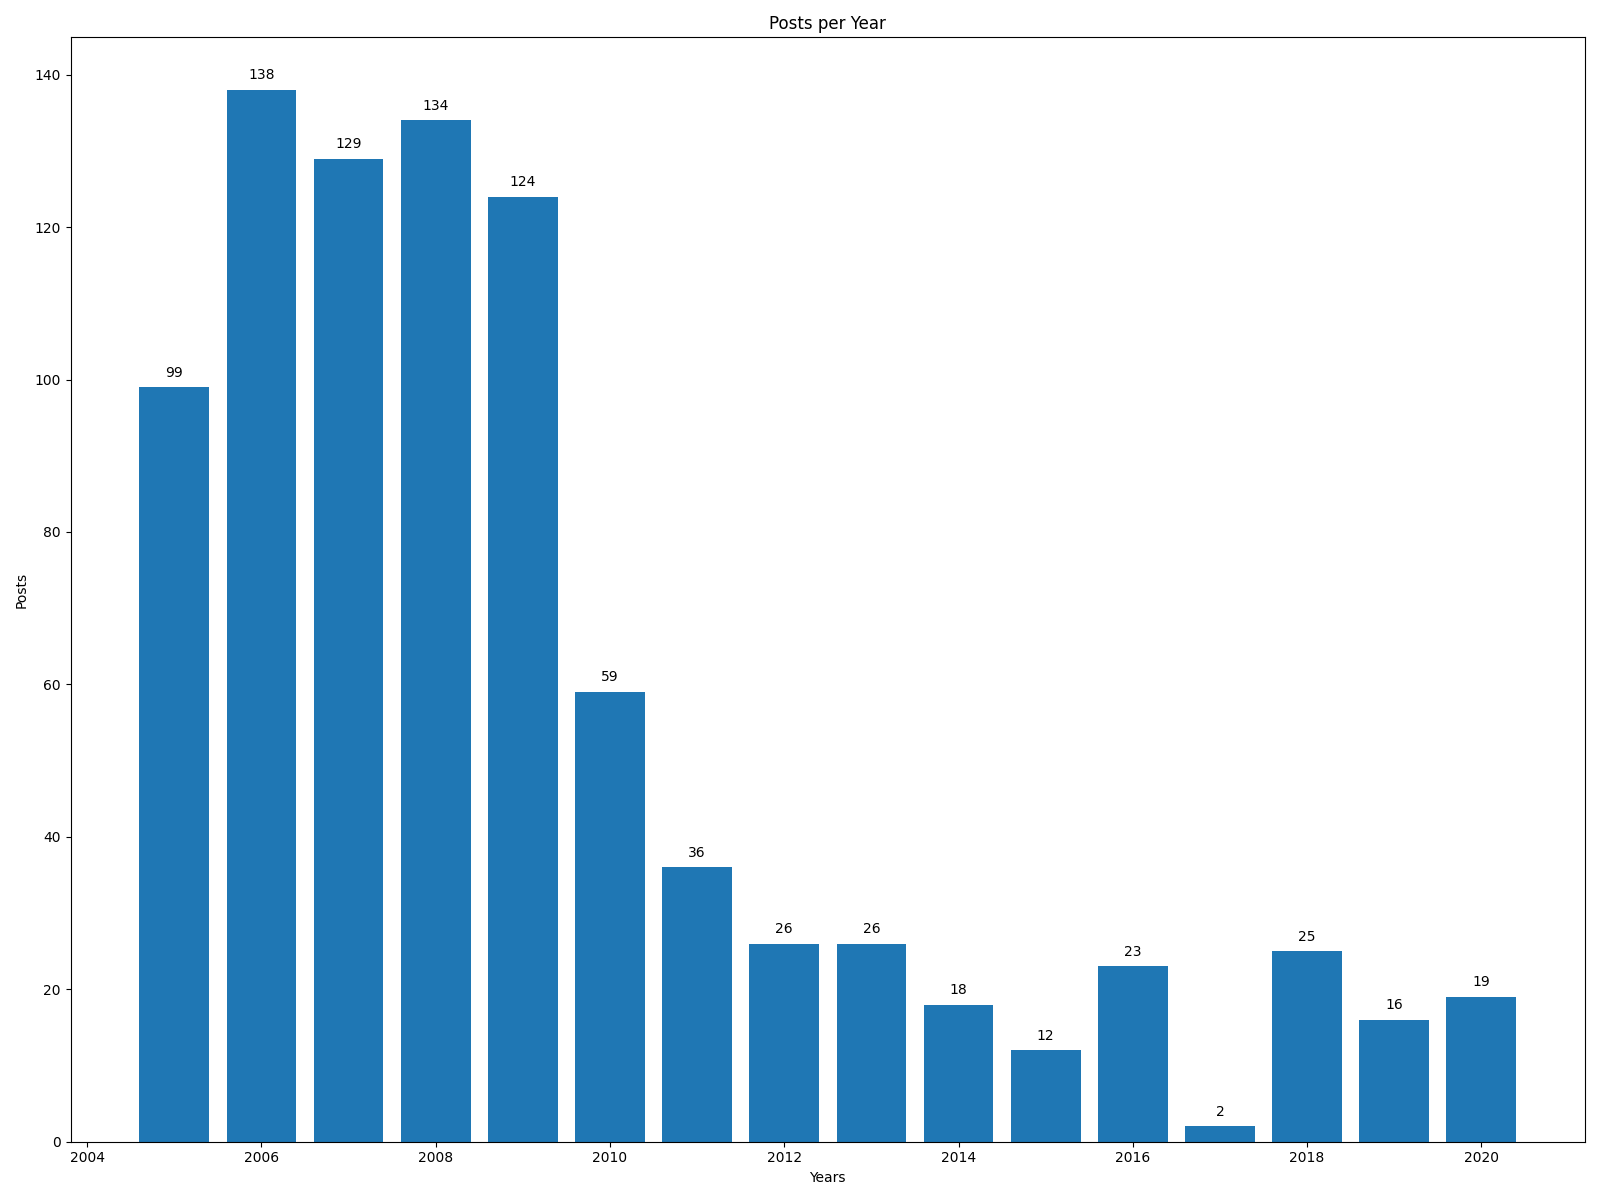
Both graphs show how, in recent years, my posting frequency has really dropped off a cliff (having a kid will do that to you, I guess). Even prior to kids, however, I was posting much less frequently than I did in the beginning.
Now that I have a new publishing platform, posting has gotten easier for me. My personal goal is to post at least three times a month, which should put me on par with 2011, which is the last time I averaged that total.